Pea vs Garlic
We scientifically analyze the biological properties of Pea and Garlic. Review the differences in macronutrients, vitamins, minerals, and our final nutritional verdict.
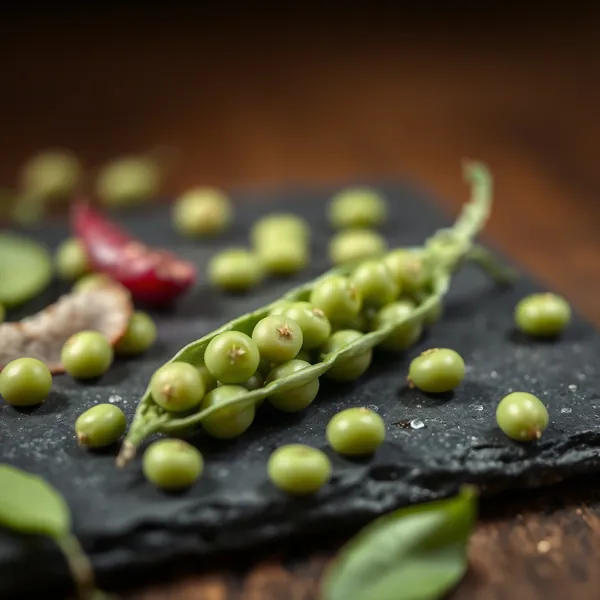
Pea
Pisum sativum

Garlic
Allium sativum
Key Nutritional Advantages


| Nutrient / Metric | Pea (100g) | Garlic (100g) |
|---|---|---|
| Calories | 81 kcal | 149 kcal |
| Protein | 5.4g | 6.4g |
| Fats | 0.4g | 0.5g |
| Carbohydrates | 14.5g | 33.1g |
| Dietary Fiber | 5.7g | 2.1g |
| GIGlycemic Index | 51 | 10 |
| Water Content | 78.2% | 58% |
Nutritional Verdict
Based on nutrient-density scores (highly bioavailable proteins, soluble prebiotic fiber, and balanced glycemic metrics), Pea is programmatically rated superior for structural cellular health.
Pea
Peas are small, round, green seeds that are packed with nutrients and are a great source of plant-based protein. They are versatile in cooking and can be enjoyed fresh, frozen, or dried.
Garlic
Garlic is a bulbous plant known for its strong flavor and numerous health benefits. It is rich in sulfur compounds, which contribute to its distinctive aroma and therapeutic properties.
Nutritional Intelligence Comparative Analysis
Cross-clinical evaluation based on micronutrient densities, absorption profiles, and bioactive compounds.
1. Macronutrient Battle and Energy Density
When evaluating energy intake, Pea provides 81 calories per 100g, compared to 149 calories in Garlic. This makes Garlic more energy-dense, converting Pea into an ideal choice for caloric control.
In the protein matrix, Pea delivers 5.4g of protein per 100g, while Garlic records 6.4g. If looking to optimize muscle protein synthesis, Garlic is superior in this macronutrient.
Carbohydrate structures and the Glycemic Index (GI) yield different metabolic dynamics: Pea has 14.5g of carbs with an estimated GI of 51, whereas Garlic has 33.1g with a GI of 10. Garlic results in a more controlled, steady insulin response.
Regarding gut health, Pea features 5.7g of fiber per 100g, compared to 2.1g in Garlic. Consuming Pea significantly favors satiety and digestive transit.
2. Micronutrient Profile (Vitamins and Minerals)
Micronutrient analysis highlights the essential vitamins and minerals of each food, expressed as a percentage of the recommended Daily Value (%DV).
Pea's profile is highly notable for: vitamin-c (40mg, 44% VDR) and vitamin-k (24.8mcg, 21% VDR) and vitamin-a (765IU, 15% VDR).
Conversely, Garlic stands out especially in: manganese (1.2mg, 60% VDR) and vitamin-c (31.2mg, 34% VDR) and calcium (181mg, 18% VDR).
3. Medicinal Properties and Bioactive Compounds
From a phytonutrient and bioactive perspective, each superfood interacts with cellular receptors uniquely to deliver medicinal and cell-protective benefits.
4. AI Clinical Verdict
We conclude with the AI Clinical Verdict. Evaluating the Nutri-Scores (Pea: 100/100 vs Garlic: 100/100), we determine that both foods possess an equivalent nutritional value.
For Weight Control / Caloric Deficit, the recommended food is Pea due to its excellent volume-to-calorie ratio and hydration/fiber content.
For Muscle Gain and Athletic Performance, the biochemically advantageous option is Garlic because of its higher protein/amino acid content.
For Glycemic Control / Insulin Sensitivity, Garlic is recommended due to its low glycemic impact.
For Cardiovascular Health and Antioxidants, Garlic stands out due to its concentration of cardioprotective compounds and key minerals.
More Recommended Comparisons
Discover nutritional differences and similarities with similar foods.

More Foods to Explore
Explore the full nutritional factsheet and recommended recipes for each.